New Research Chapter about Store Visit Patterns during COVID-19 Published

Yunlei Liang, Kyle W. McNair, Song Gao, Aslıgül Göçmen. (2021). Exploring Store Visit Changes During the COVID-19 Pandemic Using Mobile Phone Location Data. In Shih-Lung Shaw and Daniel Sui (Eds): Mapping COVID-19 in Space and Time: Understanding the Spatial and Temporal Dynamics of a Global Pandemic (Chapter 13). pp. 253-275, Springer.

Abstract:

When the World Health Organization (WHO) announced the pandemic of COVID-19, people around the globe scattered to stores for groceries, supplies, and other miscellaneous items in preparation for quarantine. The dynamics of retail visits changed dramatically due to the pandemic outbreak. The study intends to analyze how the store visit patterns have changed due to the lockdown policies during the COVID-19 pandemic. Using mobile phone location data, we build a time-aware Huff model to estimate and compare the visiting probability of different brands of stores over different time periods. We are able to identify certain retail and grocery stores that have more or fewer visits due to the pandemic outbreak, and we detect whether there are any trends in visiting certain retail establishments (e.g., department stores, grocery stores, fast-food restaurants, and cafes) and how the visiting patterns have adjusted with lockdowns. We also make comparisons among brands across three highly populated U.S. cities to identify potential regional variability. It has been found that people in large metropolitan areas with a well-developed transit system tend to show less sensitivity to long-distance visits. In addition, Target, which is a department store, is found to be more negatively affected by longer-distance trips than other grocery stores after the lockdown. The findings can be further applied to support policymaking related to public health, urban planning, transportation, and business in post-pandemic cities.

Highlighted results:

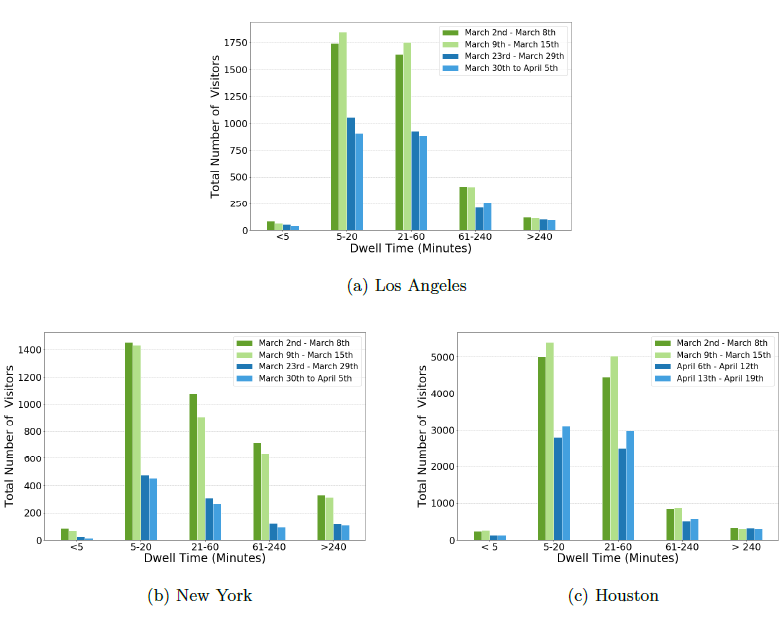
  • The dwell time distribution of visitors in Target.
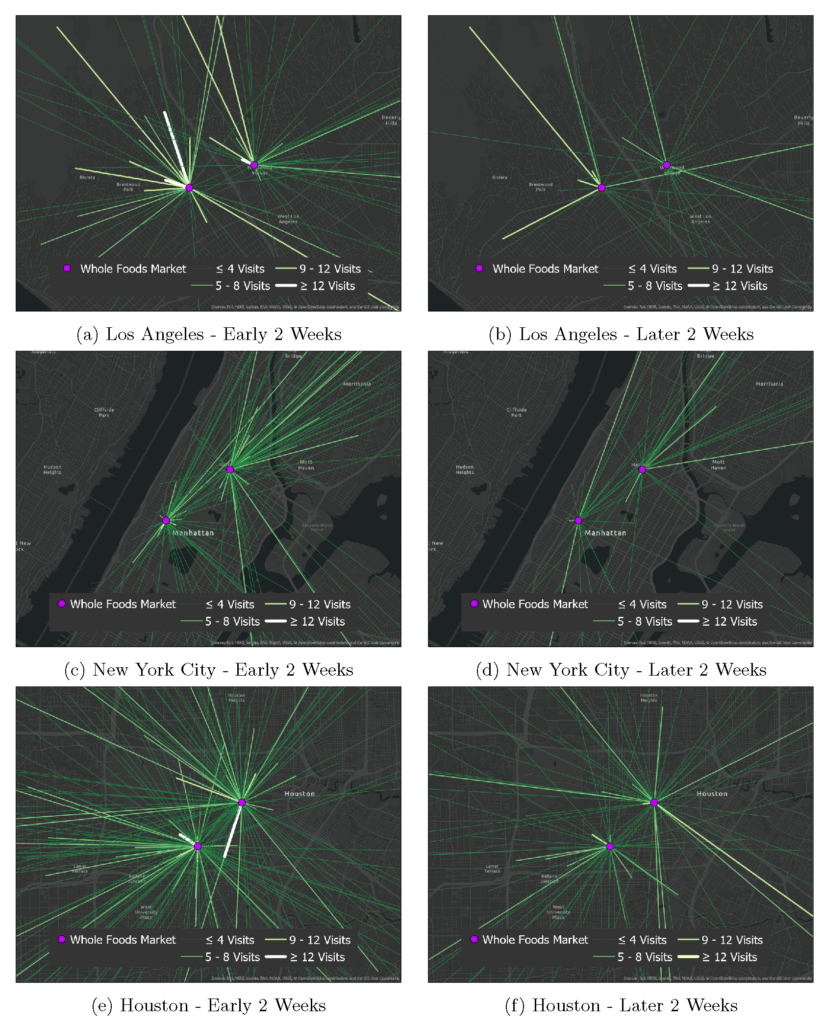
  • Frequency of Visits from home Census Block Groups to Whole Foods Markets.

New research article about Playability in Urban Environments published in CEUS

Jacob Kruse, Yuhao Kang, Yu-Ning Liu, Fan Zhang, and Song Gao. “Places for play: Understanding human perception of playability in cities using street view images and deep learning.” Computers, Environment and Urban Systems 90 (2021): 101693.

Abstract: Play benefits childhood development and well-being, and is a key factor in sustainable city design. Though previous studies have examined the effects of various urban features on how much children play and where they play, such studies rely on quantitative measurements of play such as the precise location of play and the duration of play time, while people’s subjective feelings regarding the playability of their environment are overlooked. In this study, we capture people’s perception of place playability by employing Amazon Mechanical Turk (MTurk) to classify street view images. A deep learning model trained on the labelled data is then used to evaluate neighborhood playability for three U.S. cities: Boston, Seattle, and San Francisco. Finally, multivariate and geographically weighted regression models are used to explore how various urban features are associated with playability. We find that higher traffic speeds and crime rates are negatively associated with playability, while higher scores for perception of beauty are positively associated with playability. Interestingly, a place that is perceived as lively may not be playable. Our research provides helpful insights for urban planning focused on sustainable city growth and development, as well as for research focused on creating nourishing environments for child development.

Highlighted results:

  • Our deep learning model was able to produce playability scores whose distribution closely matched that of the training data.
Chart, bar chart, histogram

Description automatically generated
  • Using images labeled by our deep learning model, we produced a map of playability scores for Boston, Seattle, and San Francisco.
Map

Description automatically generated
  • Downtown areas in the three cities studied had high lively scores but low playability scores.
Map

Description automatically generated with medium confidence