In our research, state-of-the-art computer vision and AI technologies are utilized to collect, store, handle, manipulate and analyze the human emotions and sentiment at different geographic scales. The research explored what and how people express their emotions at different places, and why and how their emotions would be influenced by environmental factors. Several maps are utilized to visualize where people may be happier than at other locations. In traditional research, we may only use questionnaires to investigate the human emotions and socioeconomic factors. But nowadays, it is possible to collect human emotions using large-scale user generated data online, including tweets, emoji, photos, articles, etc.. As we know, human emotions are innate characteristics of human beings, and with computer technology, it is possible to use objective methods to quantify the subjective human emotion. And it is quite important to build a computational workflow to handle large volumes of user generated data and extract emotion from those data efficiently. Here are several examples which we are working on.
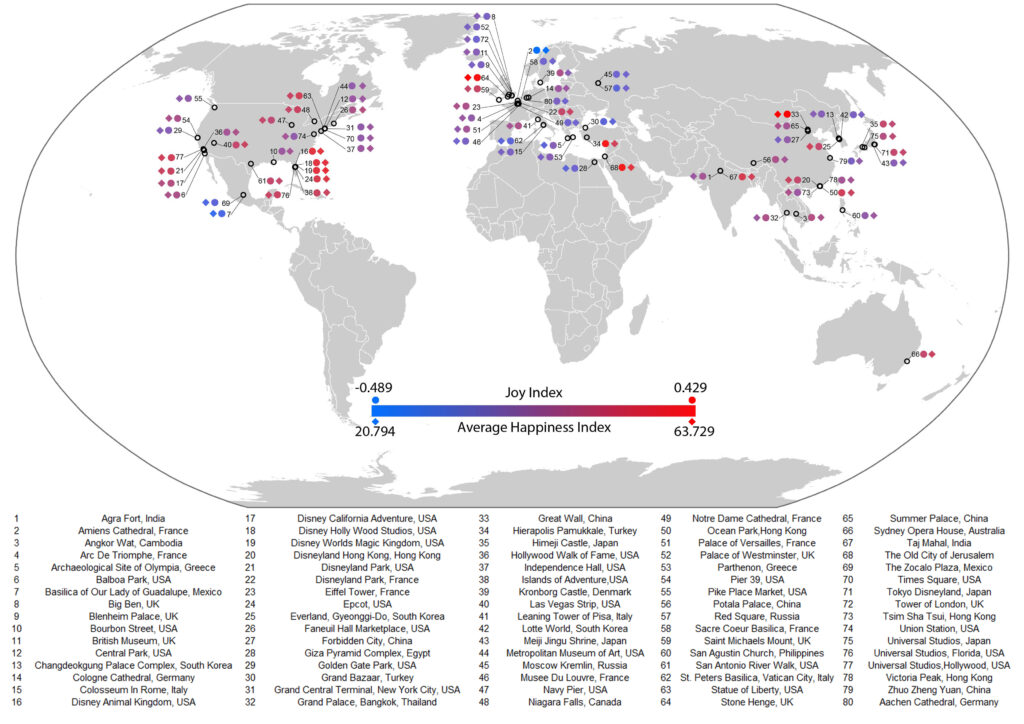
(1) Individual place scale: human emotions at different tourist attractions
In this study, a novel framework for extracting human emotions from large-scale georeferenced photos at different places is proposed. After the construction of places based on spatial clustering of user generated footprints collected in social media websites, online cognitive services are utilized to extract human emotions from facial expressions using state-of-the-art computer vision techniques. And two happiness metrics are defined for measuring the human emotions at different places. To validate the feasibility of the framework, we take 80 tourist attractions around the world as an example and a happiness ranking list of places is generated based on human emotions calculated over 2 million faces detected out from over 6 million photos. Different kinds of geographical contexts are taken into consideration to find out the relationship between human emotions and environmental factors. Results show that much of the emotional variation at different places can be explained by a few factors such as openness. The research may offer insights on integrating human emotions to enrich the understanding of sense of place in geography and in place-based GIS.
(2) Urban scale: relationship between human emotion and stock market fluctuation at Manhattan
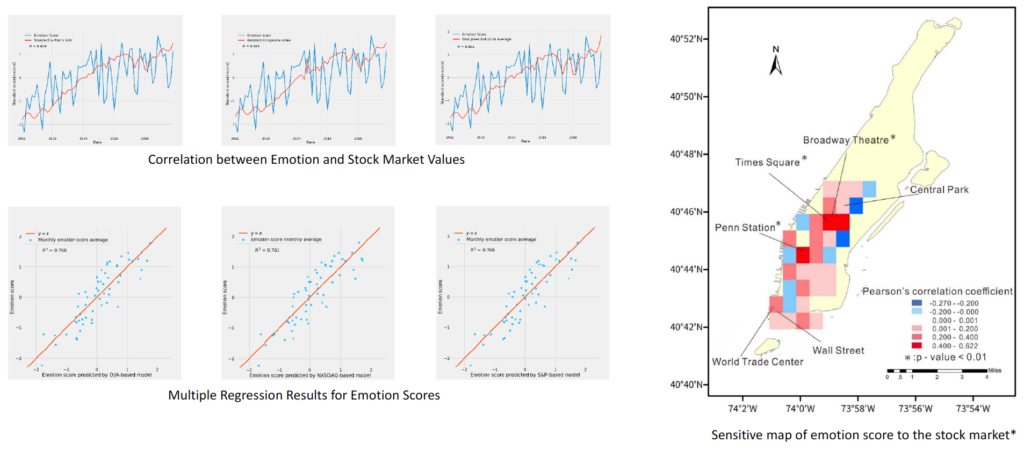
In this research, we examined whether emotion expressed by users in social media can be influenced by stock market index or can predict the fluctuation of the stock market index. We collected the emotion data in Manhattan, New York City using face detection technology and emotion cognition services for photos uploaded to Flickr. Each face’s emotion was described in 8 dimensions the location was also recorded. An emotion score index was defined based on the combination of all 8 dimensions of emotion calculated by principal component analysis. The correlation coefficients between the stock market values and emotion scores are significant (R>0.59 with p < 0.01). Using Granger Causality analysis for cause and effect detection, we found that users’ emotion is influenced by stock market value change. A multiple linear regression model was established (R-square=0.76) to explore the potential factors that influence the emotion score. Finally, a sensitivity map was created to show sensitive areas where human emotion is easily affected by the stock market changes. We concluded that in Manhattan region: (1) there is a statistically significant relationship between human emotion and stock market fluctuation; (2) emotion change follows the movements of the stock market; (3) the Times Square and Broadway Theatre are the most sensitive regions in terms of public emotional reaction to the economy represented by stock value.
(3) Global scale: global human emotions in different groups of people
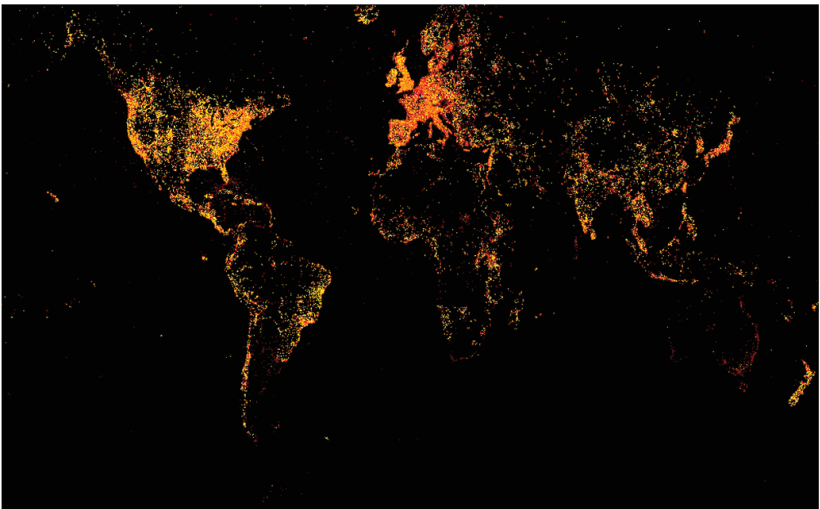
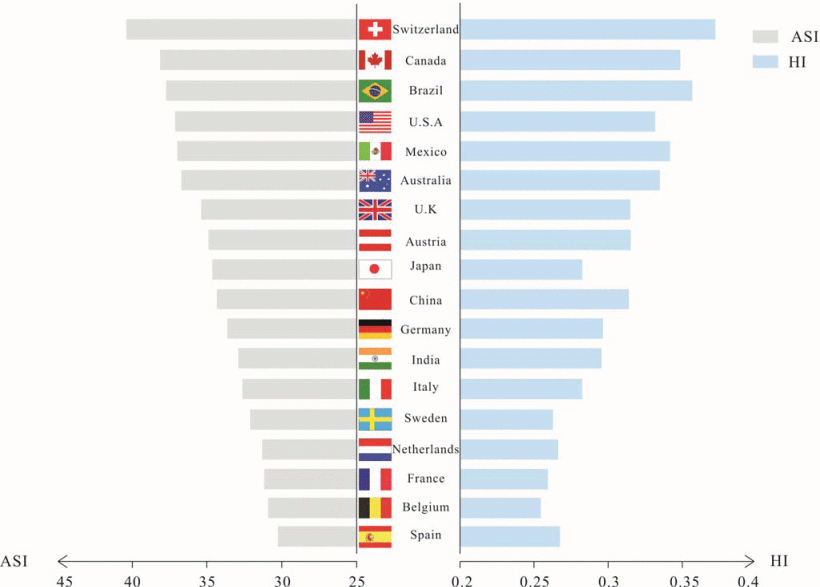
In this research, we used a huge global scale image dataset: YFCC100, to extract emotions from photos and to describe the worldwide geographic patterns of human happiness. Two indices of Average Smiling Index (ASI) and Happiness Index (HI) are defined from different perspectives to describe the degree of human happiness in a specific region. We computed the spatio-temporal characteristics of facial expression-based happiness on a global scale and linked them to some demographic variables (ethnicity, gender, age, and nationality). After that, the robust analysis was made to ensure our results are reliable. Results are in accordance with some previous studies in Social Science. For example, White and Black are often better at expressing happiness than Asian, women are more expressive than men, and happiness expressed varies across space and time. Our research provides a novel methodology for emotion measurement and it could be utilized for assessing a region‘s emotion conditions based on geo-crowdsourcing data. Robust analysis results indicate that our approaches are reliable and could be implemented for other research projects on place-based human sentiment analysis.
For more information about this research, you can also visit: http://urbanplayground.cn/Emotion/
References:
Yuhao Kang, Qingyuan Jia, Song Gao, Xiaohuan Zeng, Yueyao Wang, Stephan Angsuesser , Yu Liu, Xinyue Ye, Teng Fei. (2019) Extracting Human Emotions at Different Places Based on Facial Expressions and Spatial Clustering Analysis. Transactions in GIS (in press)
Kang, Y., Wang, J., Wang, Y., Angsuesser, S. and Fei, T. (2017) Mapping the Sensitivity of the Public Emotion to the Movement of Stock Market Value: A Case Study of Manhattan. International Archives of the Photogrammetry, Remote Sensing & Spatial Information Sciences, 42.
Kang, Y., Zeng, X., Zhang, Z., Wang, Y. and Fei, T. (2018, March) Who are happier? Spatio-temporal Analysis of Worldwide Human Emotion Based on Geo-Crowdsourcing Faces. In 2018 Ubiquitous Positioning, Indoor Navigation and Location-Based Services (UPINLBS) (pp. 1-8). IEEE.